High-Level Reporting with Recruit & Onboard Dashboards

Marketware’s Platforms provide many avenues to report on the information you need most with Recruit & Onboard Dashboards. This includes pulling and exporting lists of potential leads based on a specific specialty and county, gaining high-level insights into project progress, viewing data to identify challenges, and reporting on which are the most effective.
Recruit Dashboards
Active/Inactive Candidate Analysis
The Active/Inactive Candidate Analysis dashboard provides insight into the challenges and areas of improvement within the position-filling process.
- Look at the stages in the process where candidates regularly become inactive to see if they fall out based on either the candidates’ needs or your own organizational needs.
- Dive deeper into team statistics to know whose candidates are moving forward and gain an understanding of those whose candidates are falling out of the process.
- Compare inactive reasons to cite where improvements can be made to your process, from cultural fit to compensation or licensure and qualification needs.
Candidate Overview
The Candidate Overview dashboard provides a summary of the candidate pool within specific opportunities, places, or specialties, along with key demographics and sourcing information.
- See the cost broken down by leads, candidates, & final contracted individuals.
- Gain demographic insight into which sources are providing the most diverse, qualified individuals.
Days to Fill
The Days to Fill dashboard helps leadership gain insights into the average time it takes to fill an opportunity for a given specialty, place, or recruiter.
- Break down processes to understand how long candidates spend in each stage, guiding choices to cut out unnecessary processes or recognizing areas that may take longer.
- Discuss the process with team members by boosting those with a fast process while encouraging those who may need more support & have longer days to fill.
Days Open by Specialty
The Days Open by Specialty dashboard gives you insights into how long each specialty requisition takes to fill. See the specific opportunity specialty, the number of days this requisition has been open on average, and how long it takes to hire a candidate on average.
Physician Commonalities
Hiring the right provider means painting a picture of how well they will fit into their new community. Utilize the Physician Commonalities dashboard to identify other candidates and providers with similar backgrounds and common interests.
Opportunity Overview
The Opportunity Overview dashboard rolls up numbers based on open vs. filled positions, including opportunities filled and providers’ start dates by specialty. This is great for meetings where executives want a high-level picture of what is open and outstanding.
Recruitment Activity Summary
The Activity Summary dashboard provides an interactive visualization of tracked activities within the application. Gain high-level insights into the progress of projects, view data to identify challenges, and report on which ones are the most effective.
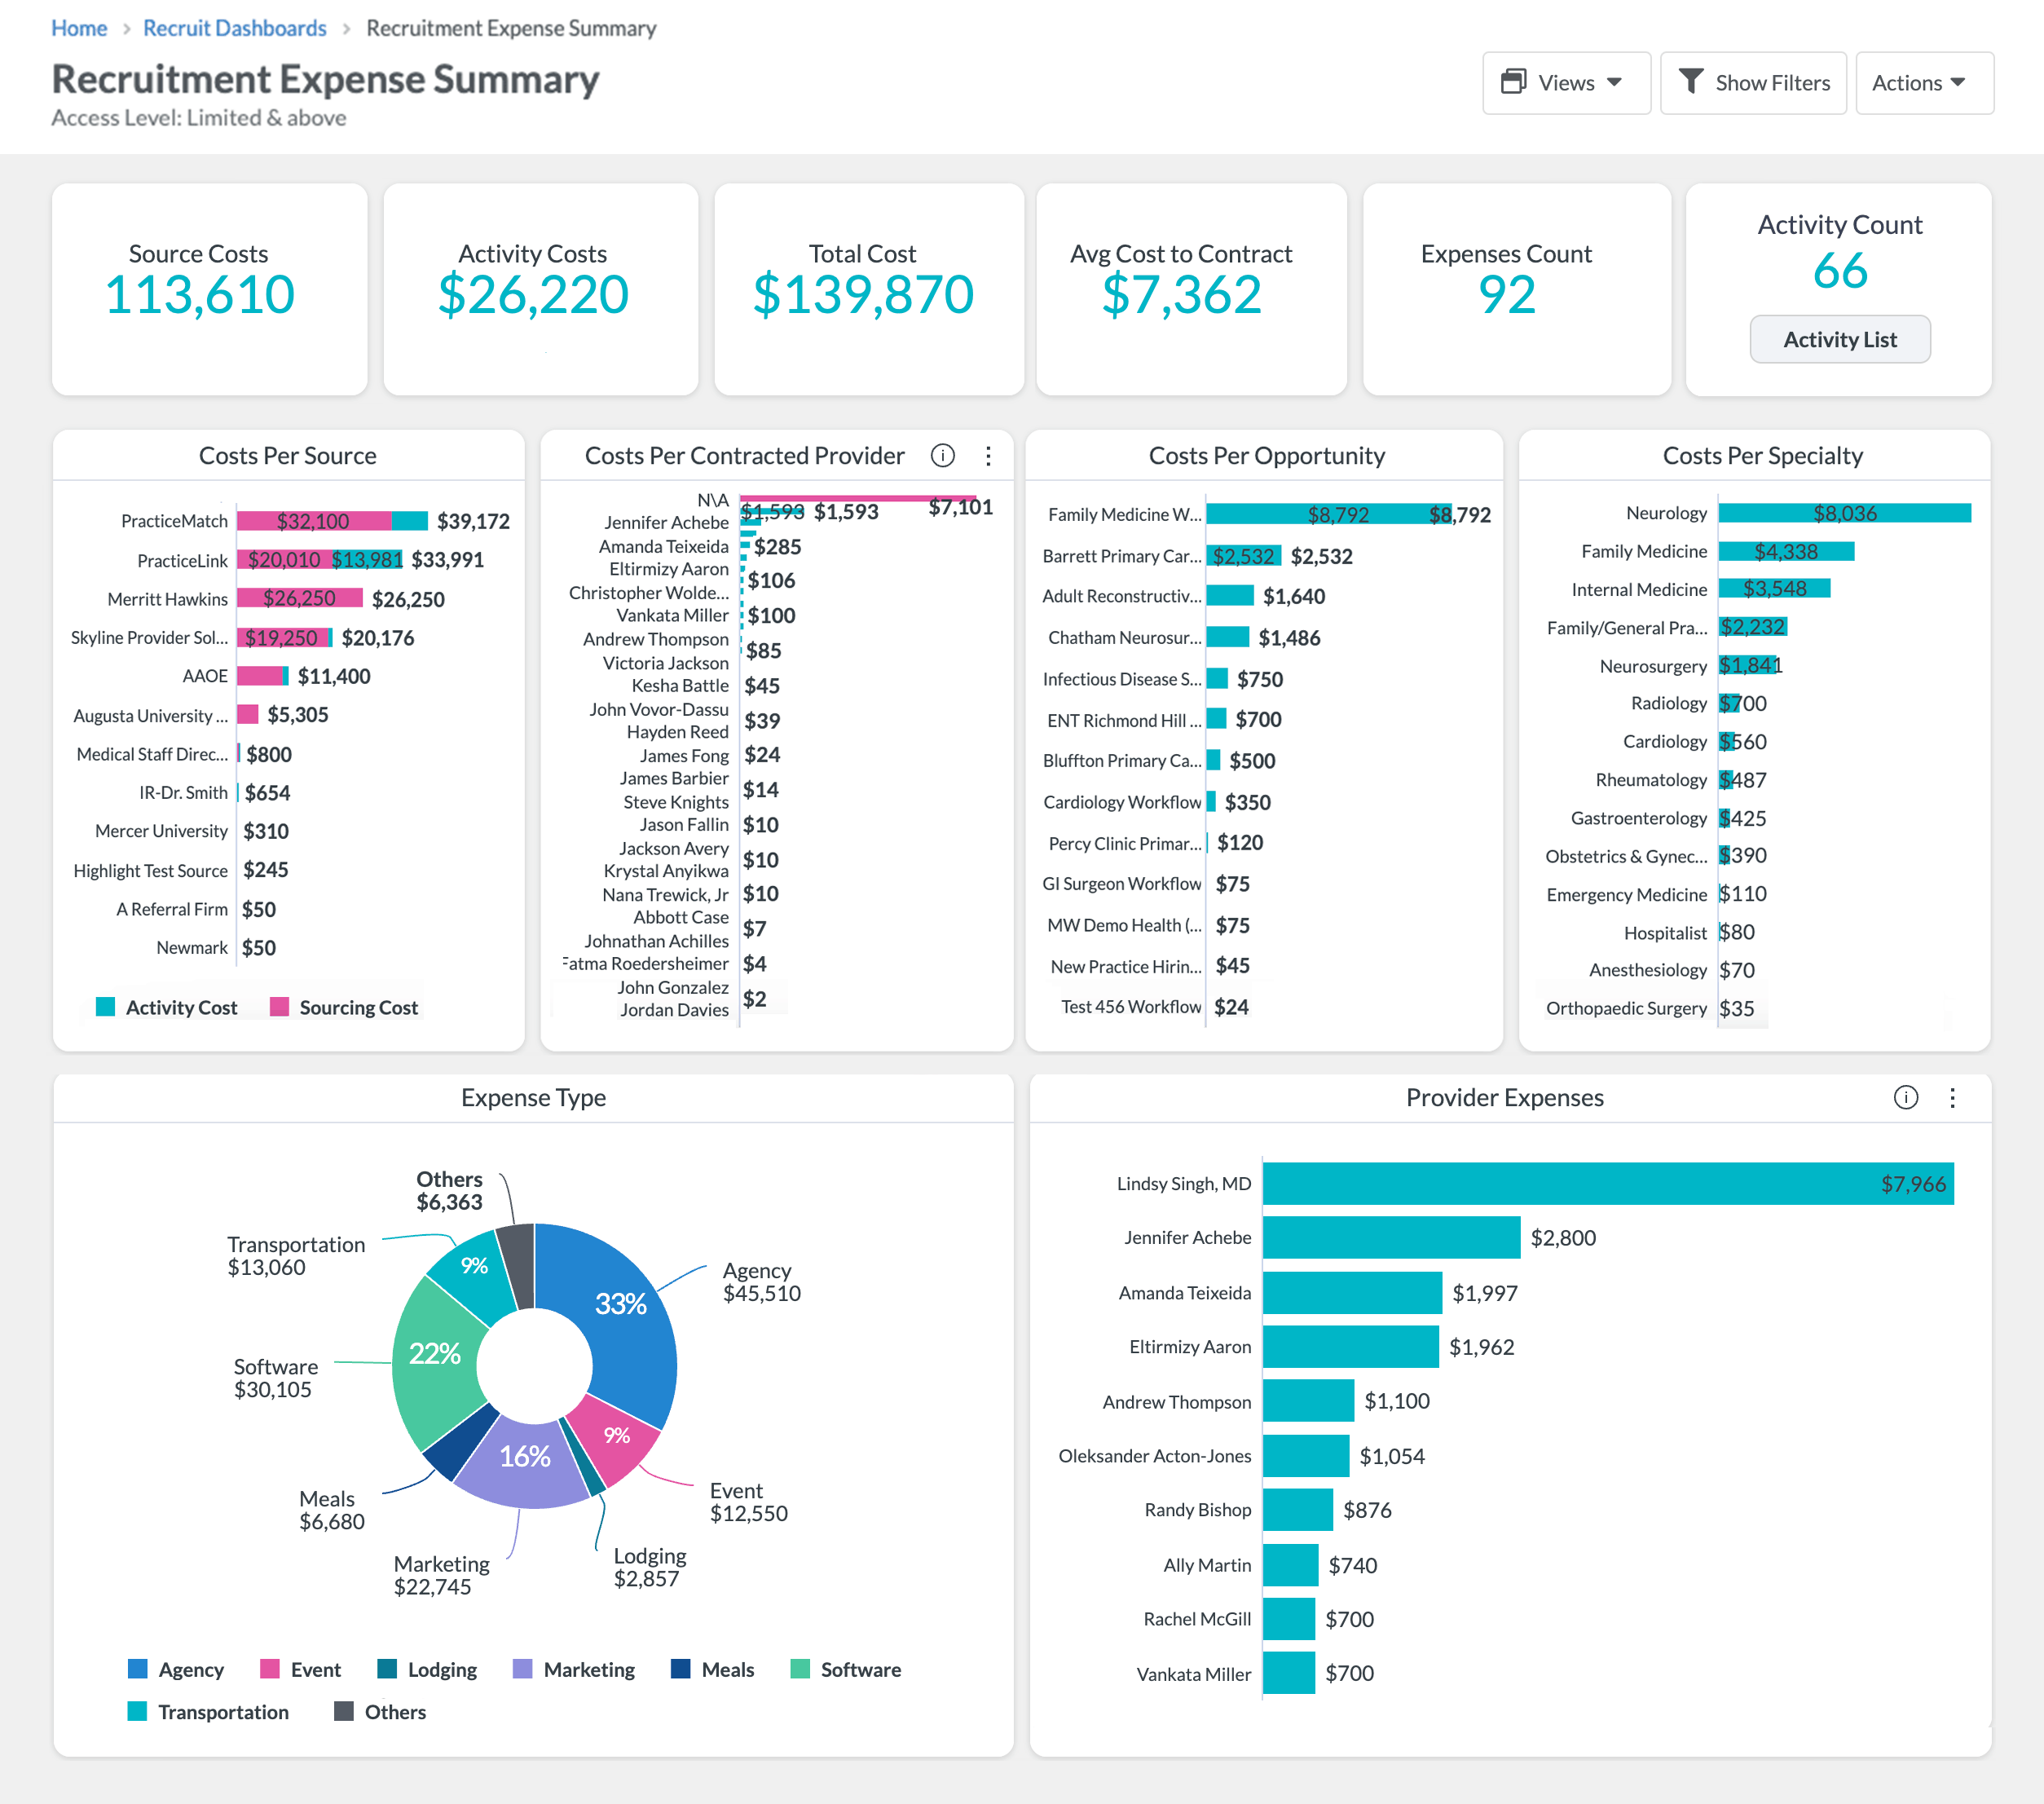
Recruitment Expense Summary
The Recruitment Expense Summary dashboard breaks down the cost per candidate, opportunity, source, and recruiter. Find out how much your organization is spending per requisition to contract a candidate.
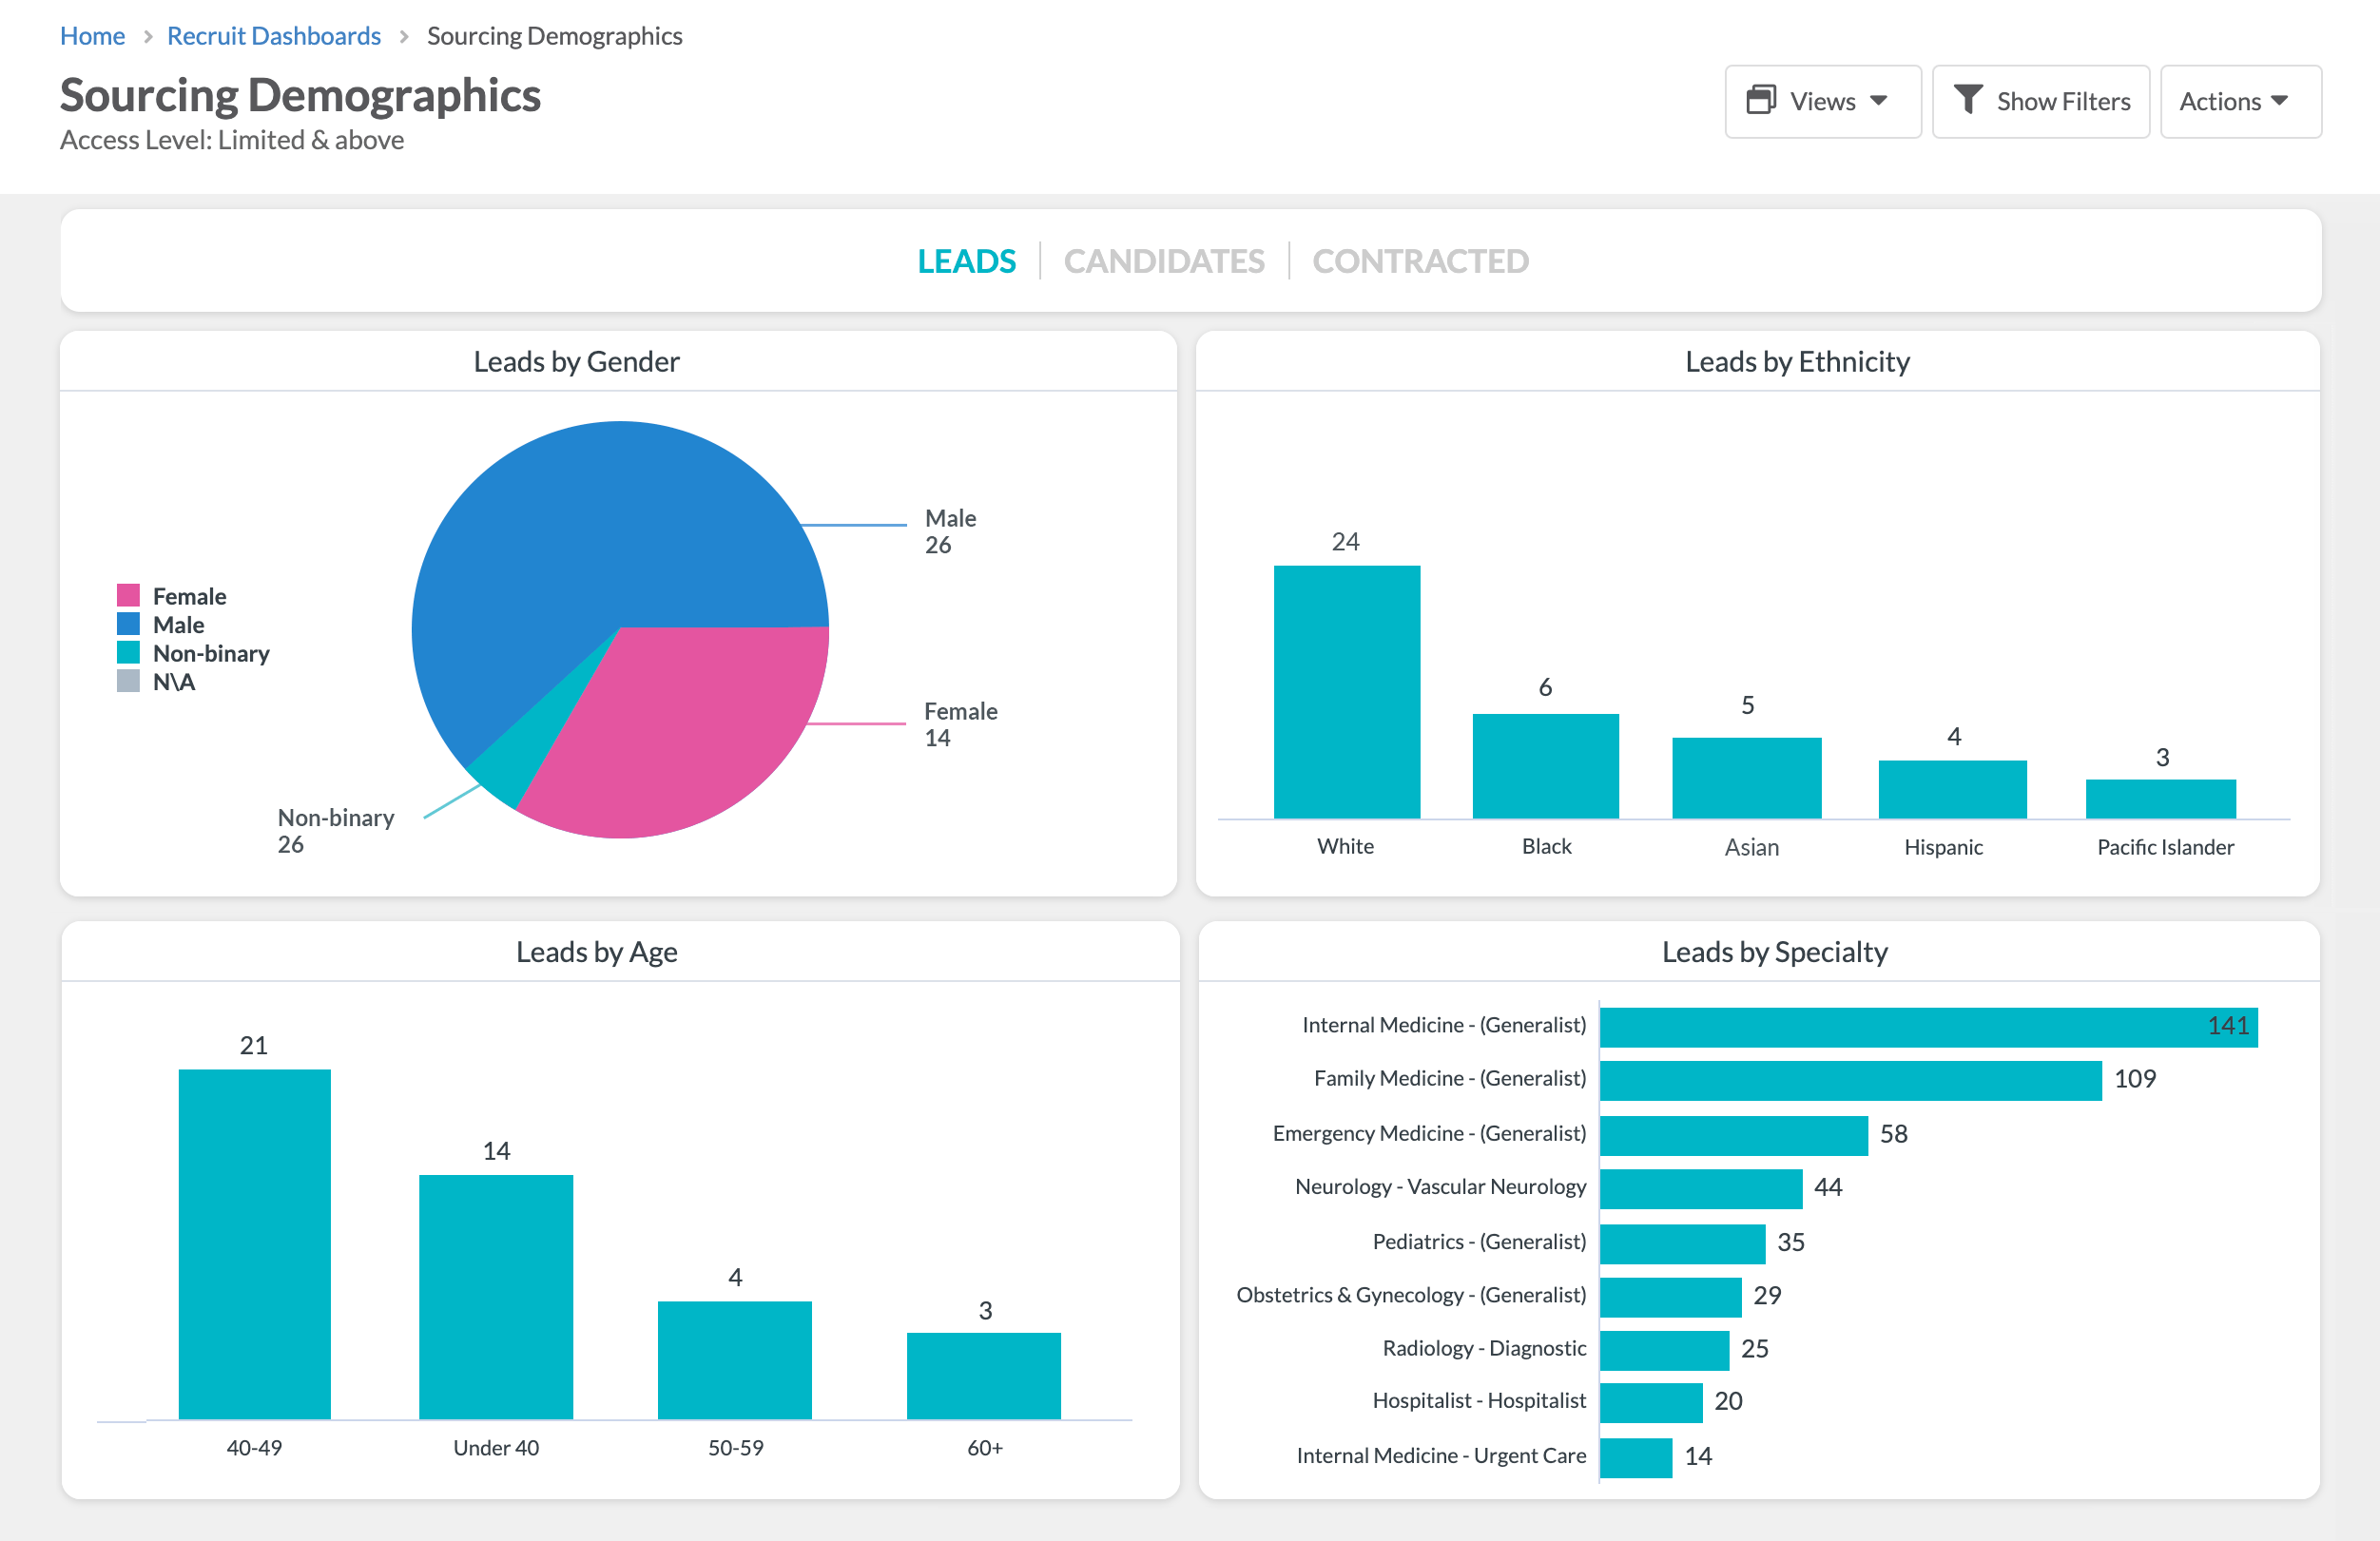
Sourcing Demographics
In the Sourcing Demographics dashboard, you can identify key information about your leads and candidates coming from your sources, such as gender, ethnicity, and age.
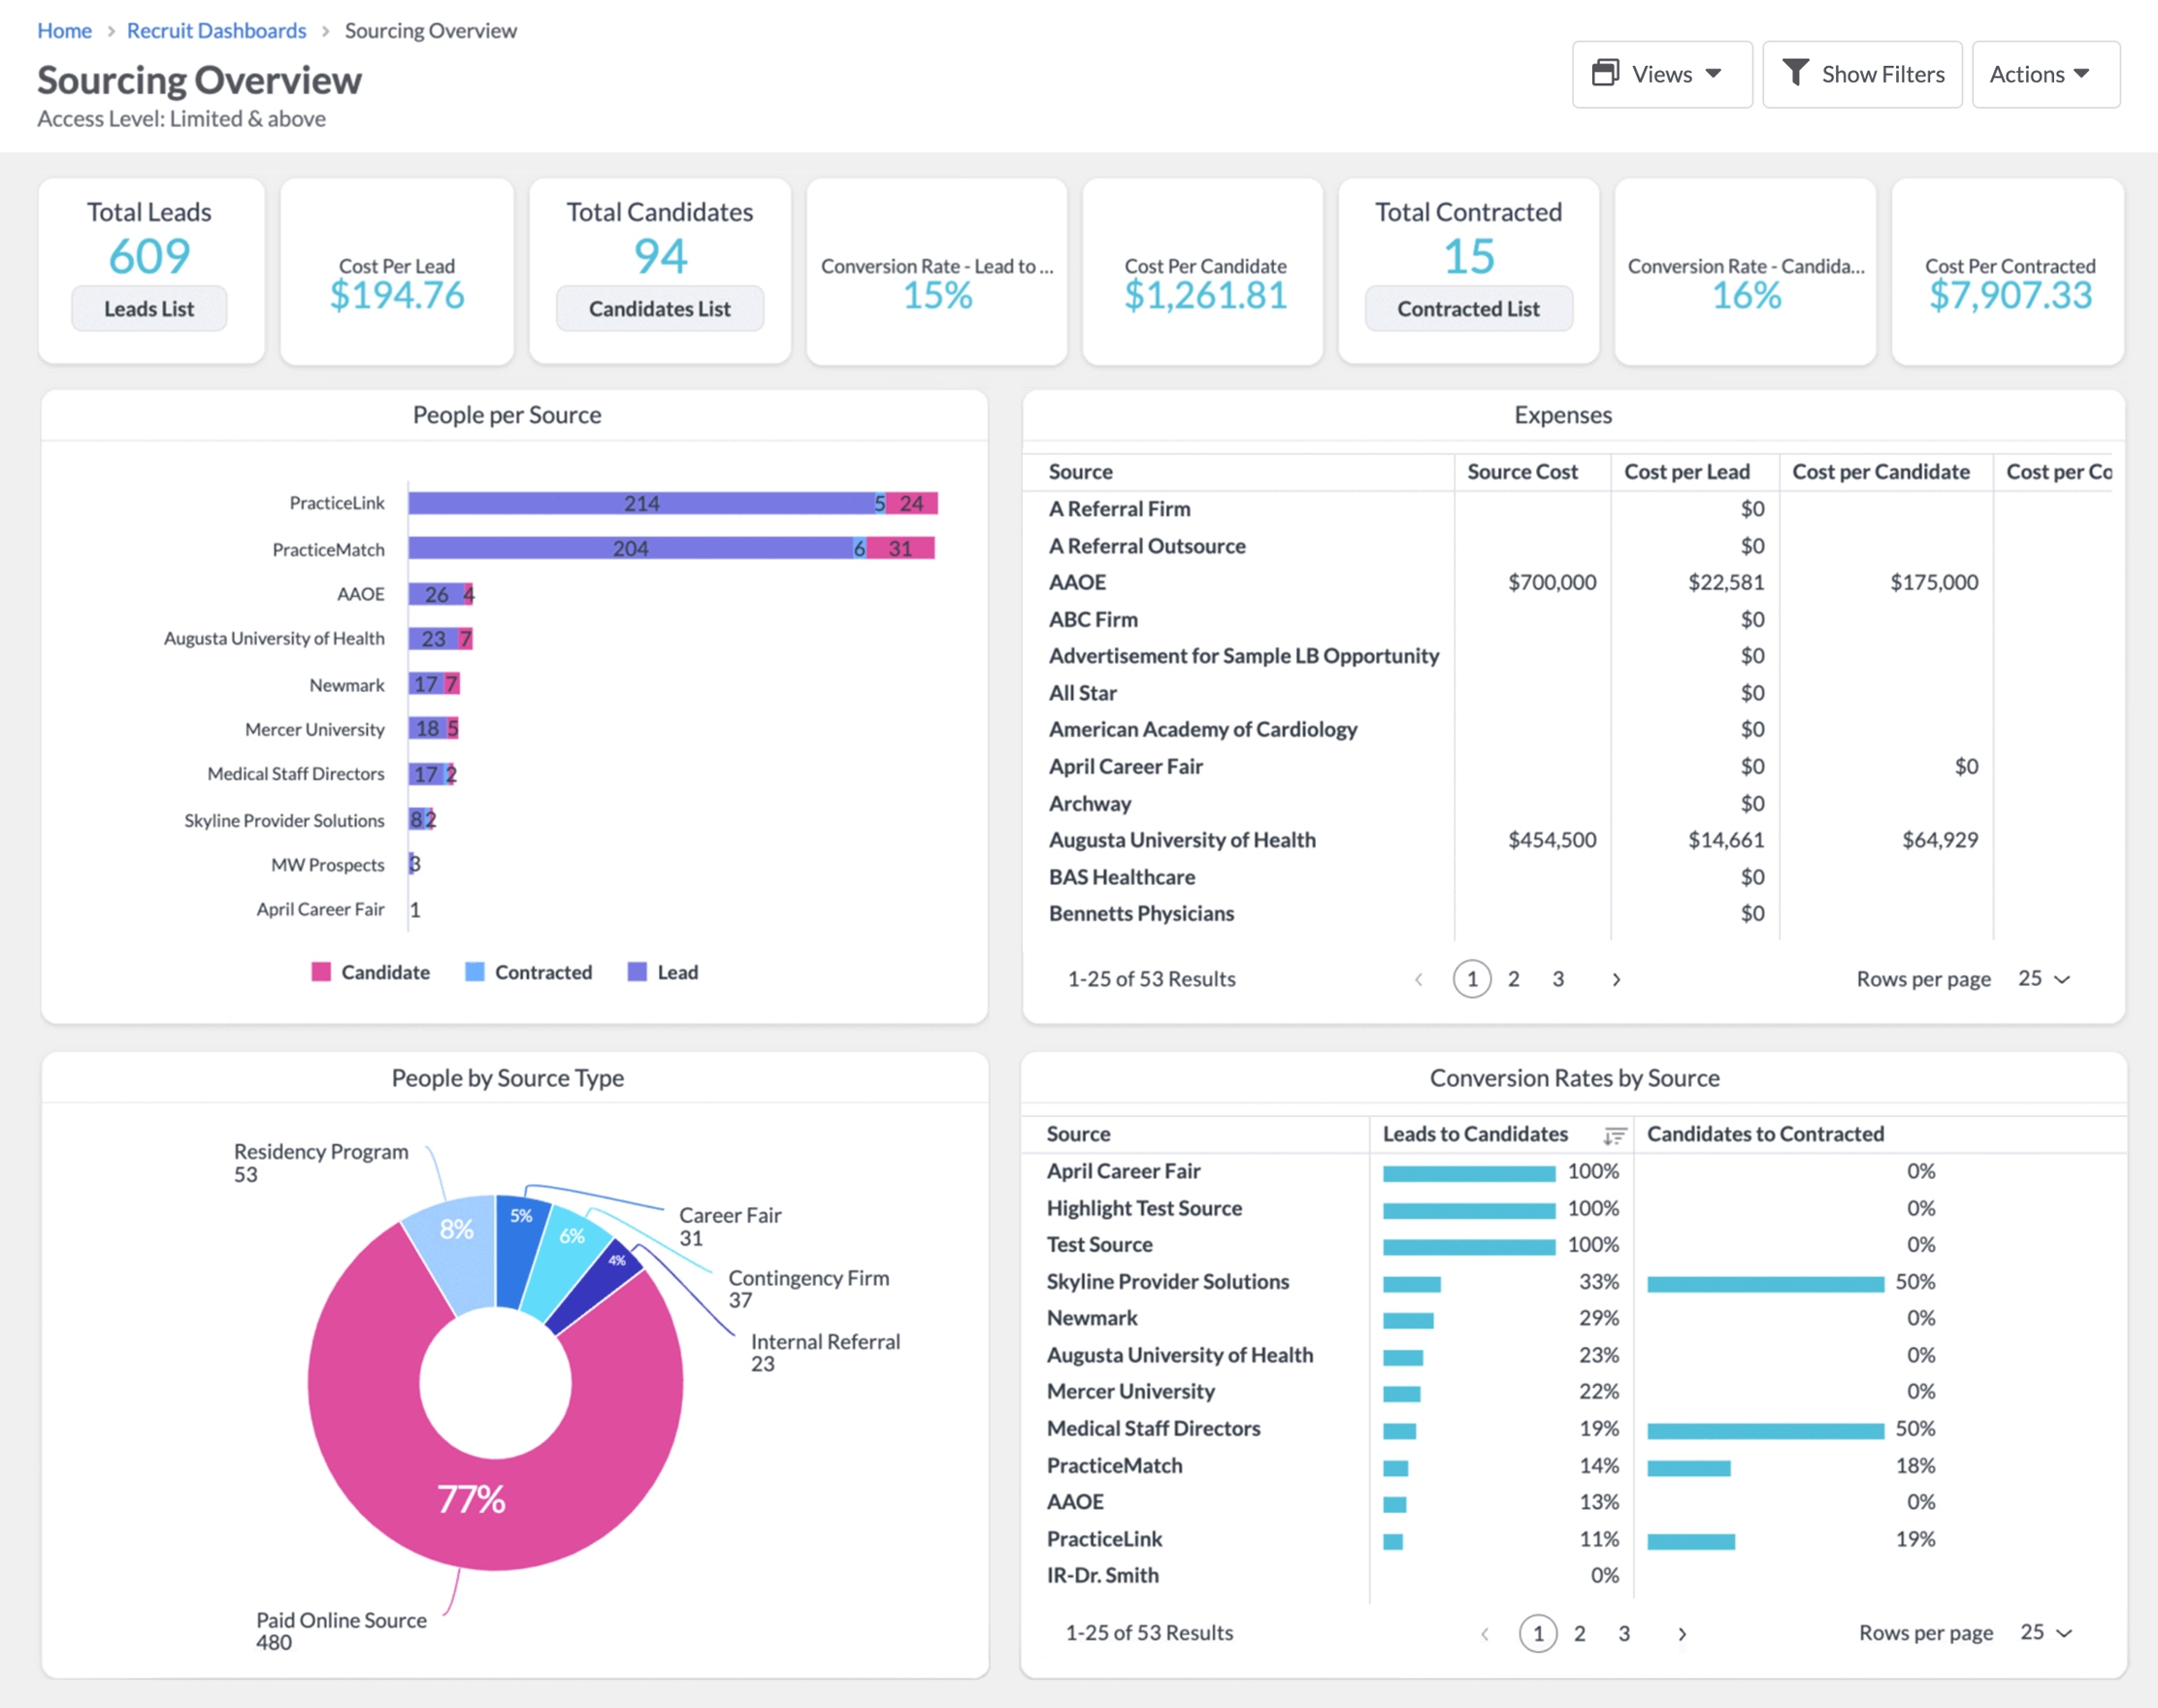
Sourcing Overview
The Sourcing Overview dashboard allows for a deep dive into the cost and conversion rate of candidates to contracted providers for each source. Use this report to identify high conversion sources with the most efficient cost to make decisions about who to partner with more regularly.
Onboard Dashboards
Onboarding Challenges
The Onboard Challenges dashboard helps to better identify challenges and areas of improvement to the onboard process and helps to retain providers more effectively.
- Break down any changes to provider launch dates by project, specialty, and assignee, providing insight into areas of the process that might need attention.
- Compare launch date change reasons from state licensure and credentialing to facility/equipment issues.
Onboarding Performance Summary
Use the Onboarding Performance Summary dashboard to understand the overall metrics per provider based on the provider’s specialty, place of onboard, the onboard coordinator assigned, and provider start months.
Onboarding Project Team Summary
The Onboarding Project Team Summary dashboard provides an interactive visualization of tracked activities within the application. Gain high-level insights into the progress of projects, view data to identify challenges, and report on which ones are the most effective.
Physician Commonalities
Successfully onboarding a new physician means integrating them fully into their community. Utilize the Physician Commonalities dashboard to identify new providers in similar areas who may have shared personal or professional interests, may hail from the same hometown, or perhaps attended the same university.
Provider & Group Progress
While Onboard Projects may invariably differ slightly from one another, Marketware understands the common activities that need to be completed for most providers to be onboarded successfully. The Provider & Group Progress dashboard tracks all provider progress with a breakdown by each project group within the project. Identify which teams may be falling behind and which providers are at risk or off track of hitting their start date based on activities not being completed.

Demo — Physician Onboarding
An Inside Look at Marketware’s Onboarding Platform
Our healthcare-specific recruitment and onboarding platforms are designed by industry professionals to streamline your hiring process, helping you source, qualify, and retain the best providers with ease. Interested in learning more about how Marketware’s Recruit Platform can help?

Tool Kit — Physician Onboarding
Physician Onboarding Plan
This toolkit provides essential templates and guides to ensure a smooth transition for new providers, from their first 100 days to full integration within your organization. Inside, you’ll find structured assessment plans, onboarding checklists, referral development tools, and communication strategies — everything you need to support and retain top medical talent.


