Scout Dashboard Overview
Dashboard Viewing, Filtering, Actions, Tips & Tricks
Permissions & Restrictions
Permissions
Administrators: Can edit, delete, and view all dashboards, even those outside of their access level. Can assign and adjust access level on dashboards.
Standard Users: Cannot edit or delete dashboards. Can only view those dashboards with their same access level. Can create their own saved views for dashboards.
Term Definitions
Access Level: the permission option to determine which level a dashboard should be available.
Widget: One section of a dashboard that includes data.
Jump Out: Refers to secondary dashboard lists that can be clicked to open in a new tab.
Workbook: A way to save a view with a selection of filters within a dashboard. These are housed under the Menu button in the dashboard.
Restrictions or Pre-Requisites
Users have access to dashboards based on the access level assigned to the dashboard.
Access Dashboards
Dashboard Categories
Depending on your organization’s agreement with Marketware, you will have access to certain dashboard folders and categories from PRM to Internal or External Claims Data.
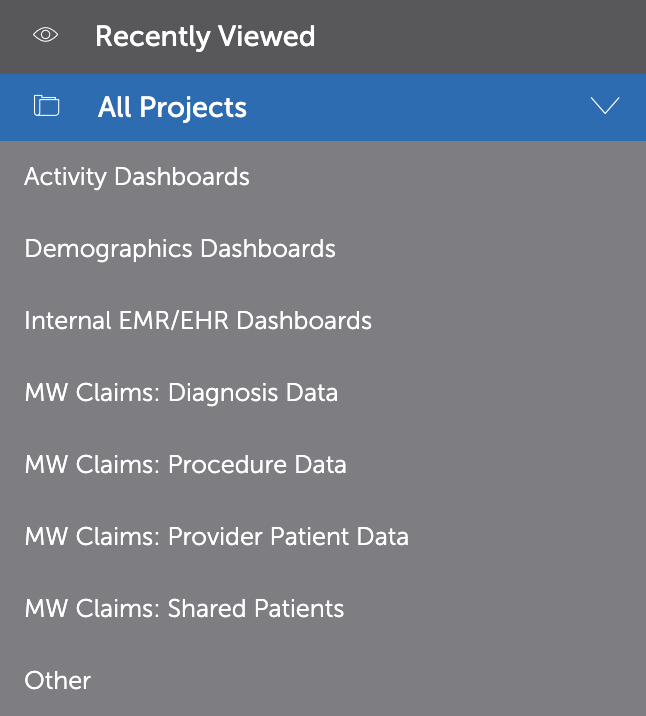
Your folder will automatically default to “Recently Viewed” dashboards. Select the folder category relating to your search to view available dashboards, or select “All Projects” to see all available dashboards at once.
- Activity Dashboards: Views relating to PRM Activities, Issues, Initiatives, & Expenses.
- Demographics Dashboards: Views relating to Provider Demographics, Facilities Information, & Email Lists.
- Internal EMR/EHR Dashboards: Views relating to Internal EMR/EHR data coming from your organization.
- MW Claims: Procedure Data: External Claims Data relating to Provider Procedure Data.
- MW Claims: Provider Patient Data: External Claims Data relating to Payer Mix & Patient Origin.
- MW Claims: Shared Patients: External Claims Data relating to Shared Patients, Trends, & Loyalty.
Open a Dashboard
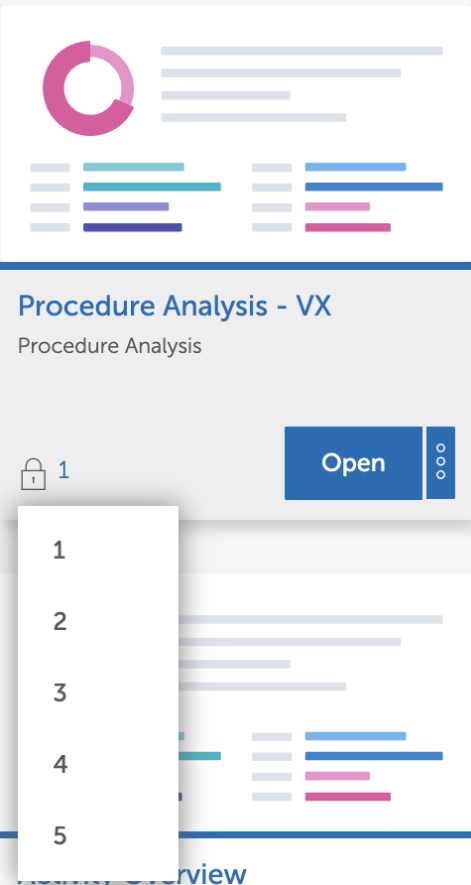
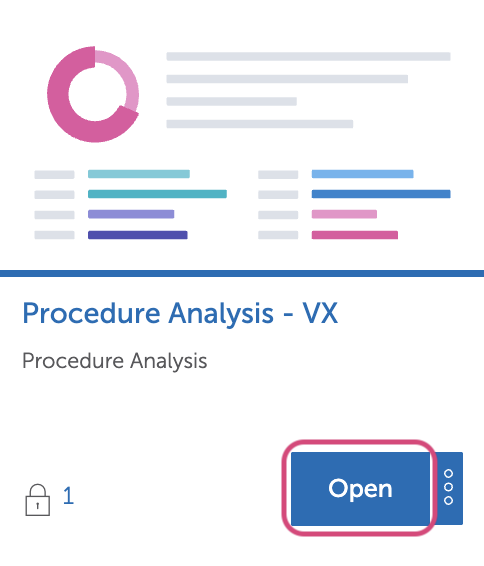
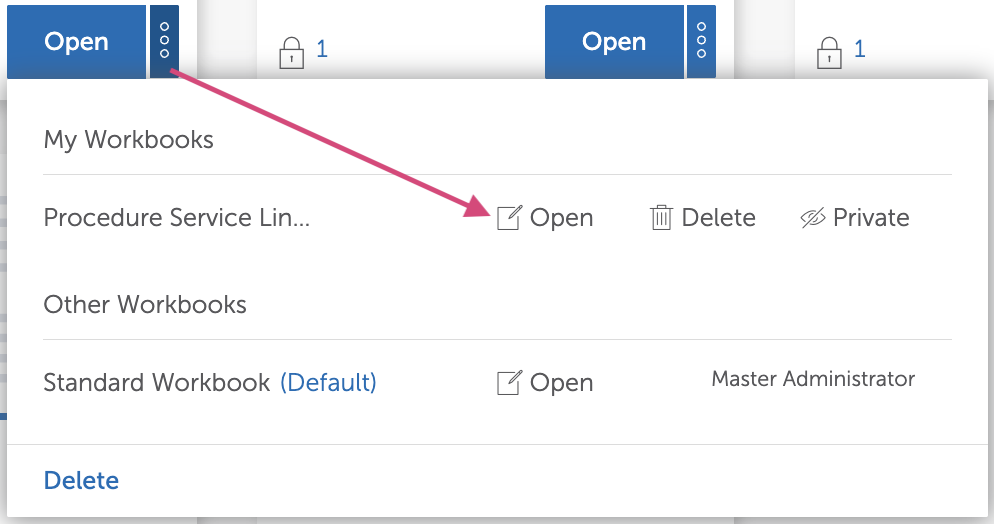
Within the folder category, you will see a list of several dashboards. Each dashboard will have a thumbnail, a dashboard name, and a description. Click on the “Open” icon to access the dashboard. Click on the ellipses icon to open directly into a Saved View by selecting the Open icon on your desired saved view.
Layout & Features
Marketware has created comprehensive and informative dashboards with overview and breakout tabs. Visualizations include bar graphs, pie charts, maps, and detailed lists. Review the information below for additional details on the dashboard layout and features.
Widgets
Each dashboard consists of several widgets, which are clearly defined by separate boxes with visualizations. Some widgets are interactive, and you can drill down, select, or download each individual view.
Toggle Views
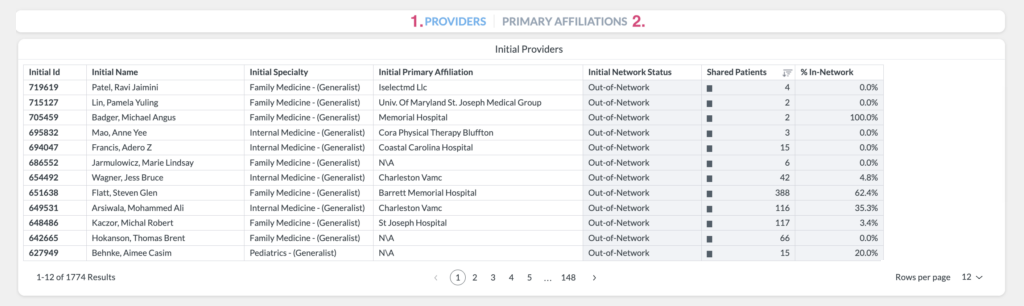
In some dashboards, you will notice a highlighted category with additional categories greyed out. This will allow you to toggle between different views within the widgets. In this example, you can toggle between viewing data by Providers or by Primary Affiliations.
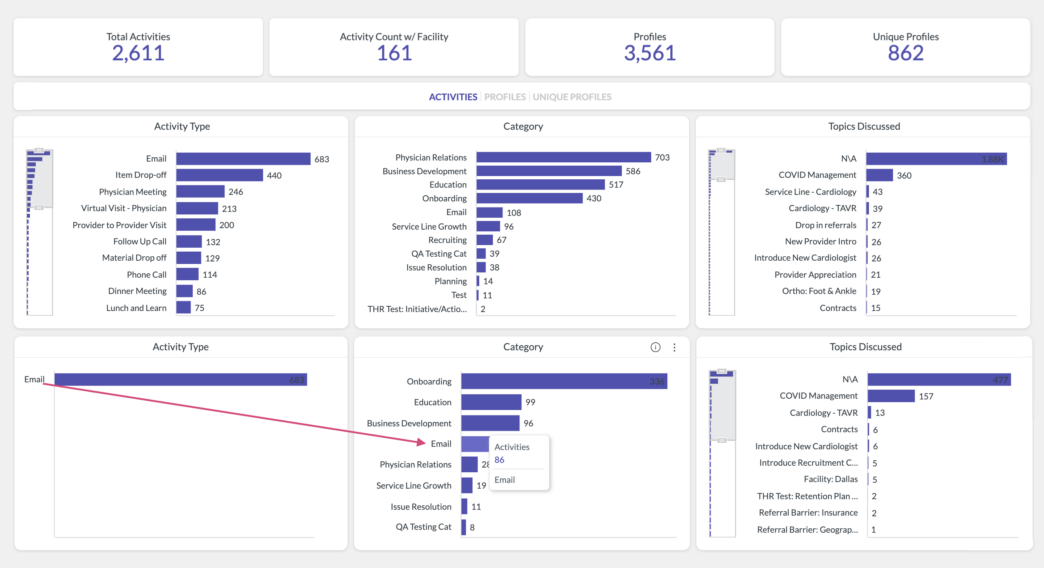
Jump Out View
Whenever you see a grey box icon with a short description, this indicates the dashboard has a jump-out view. Click on the jump-out icon to open a new dashboard view in a new browser tab. Some dashboards have several different jump-out views. You will have additional options to filter, view, and download from the jump-out view.
Use Filters
Filters are located on the right-hand side of the dashboards, and additional filters are at the bottom of some views. Each filter will have a title and a list of available options. Some filters will connect. Wait until the dashboard fully loads before applying filters.
Drop-Down Filters
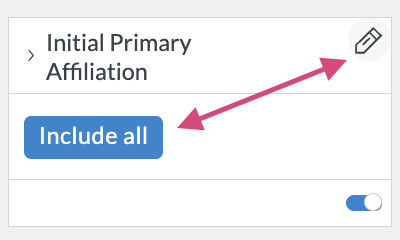
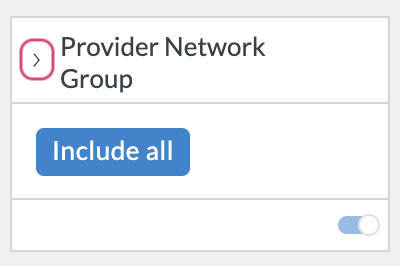
By clicking on the edit pencil or the blue icon under each filter title, you will open a list of available filter drop-down options to include or exclude.
To quickly select filters, click the caret to the left of the filter title to check & uncheck options.
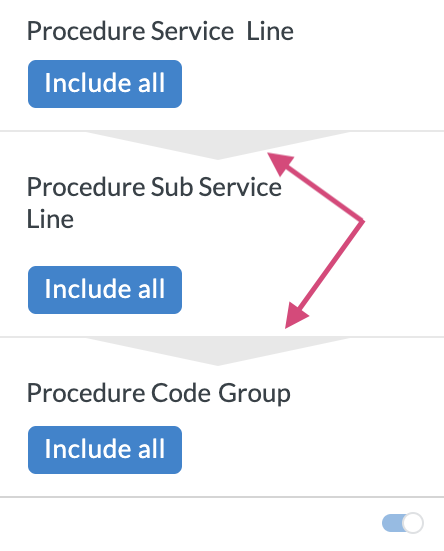
Connect Filters
Some filters are connected or cascaded, and the options available are only related to the parent filter above. A connecting or cascading filter can be identified by filters being grouped in one section as well as the grey overlay indicating the cascade from one filter down into another.
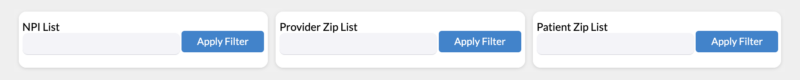
Zip & NPI Filters
Some dashboards include Zip Code and NPI List filters. Here, you can copy and paste either directly from Excel or a comma-separated list.
Select Filters
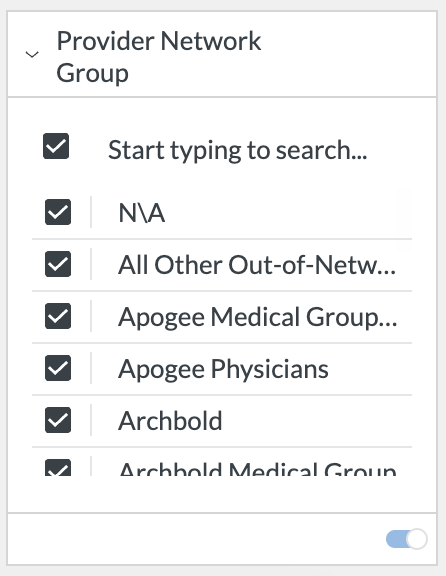
Once a filter list is open for editing, use the check search and select to choose the desired filters. Searching values has been streamlined to be more efficient, and selected filters will now reside at the top of the filter selections to indicate at-a-glance what is already selected
The Select All option will be enabled once all results have been scrolled through to the bottom of the list. If a search has been made, select all will only select the current options shown.
Some dashboard views are filtered by Date. Date filters include several options for refining the date search, including time span by year, quarter, month, week, day, hour (aggregated), & 15-minutes (aggregated), date range, or not included within a given date specification.
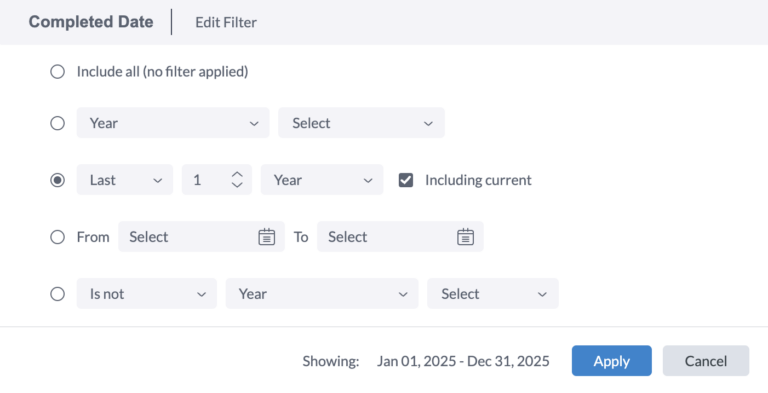
Note: All date filters will now be defaulted to this year, including today’s date.
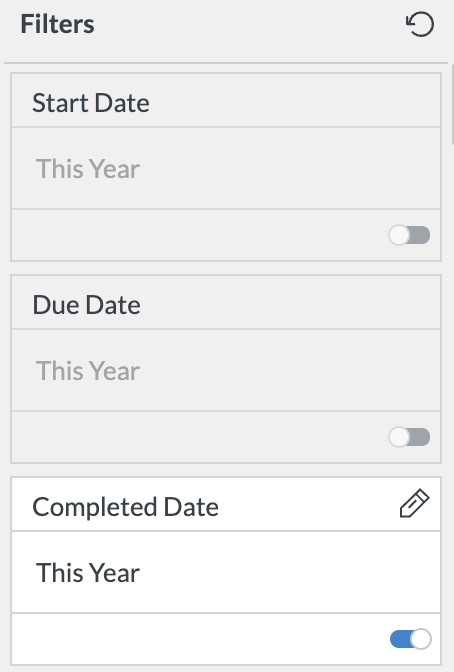
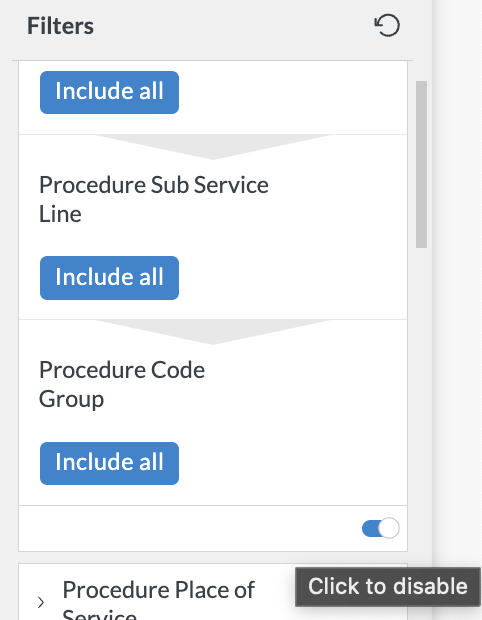
By clicking on an individual filter’s toggle it will disable that filter.
Apply & Clear Filters
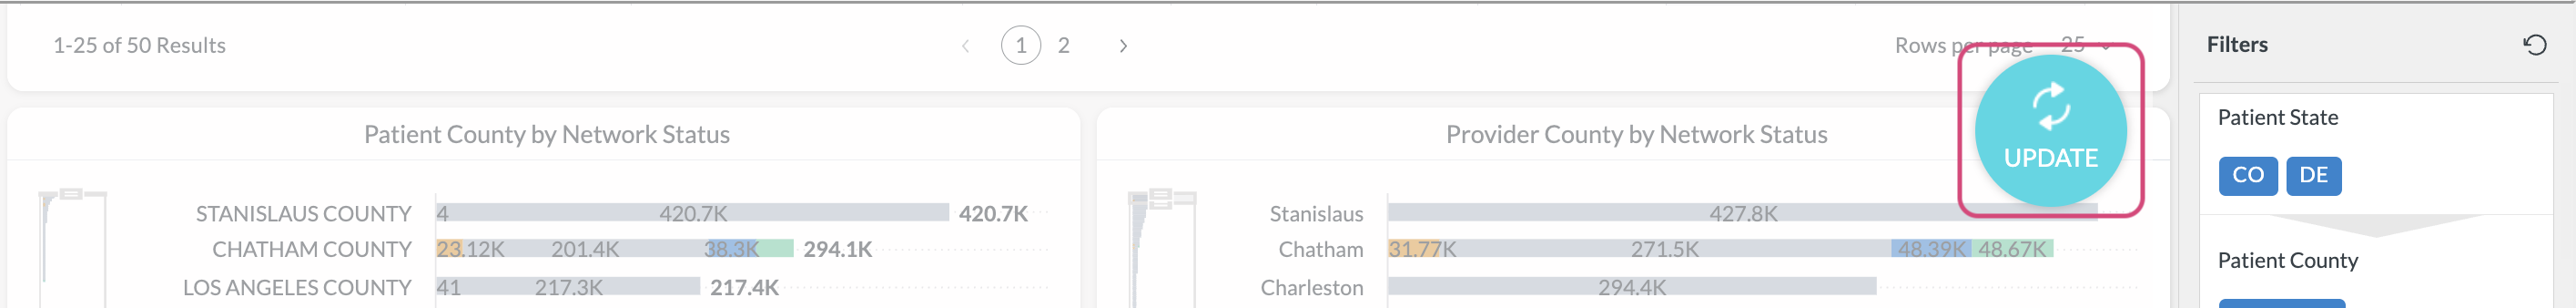
Once you have gone through with selecting all your desired filters, click on the teal blue “Update” icon next to the filters to apply. This update button allows you to select one or more filters at once and apply them at the same time, reducing the load time of the dashboard.
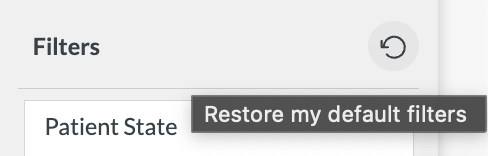
To clear all existing filters and revert to the original dashboard options, click the reverse arrow to the right of the “Filter” header.
Select & Drill Down
Drag & Scroll
If there is a bar chart that is too long to show all the data, instead of a typical scroll feature, it will have a bar to the left side of the widget that you can drag and adjust to show fewer items. Then, you can use the adjusted size of the bar to view additional data by dragging it up or down.
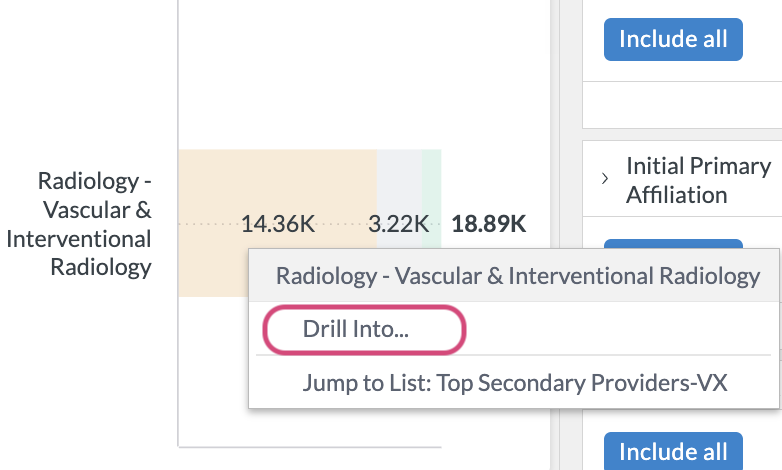
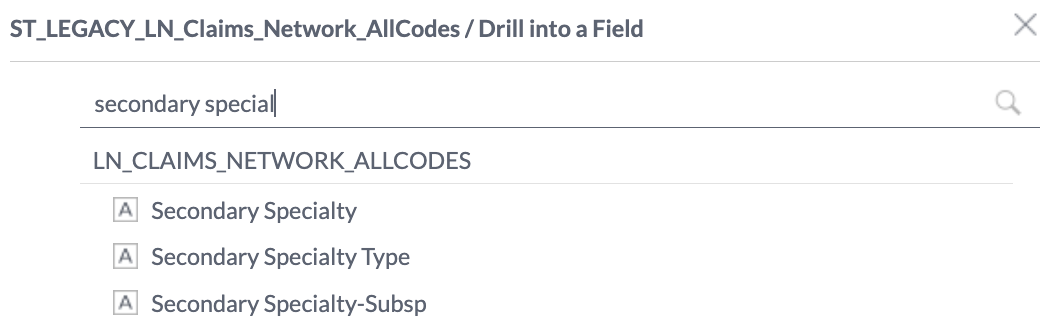
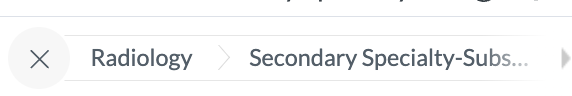
Click to Drill
You can right-click on drill into additional views within certain widgets. Selecting Drill Into will open a dialogue box to drill the filter further. Clear the selection by clicking the X icon.
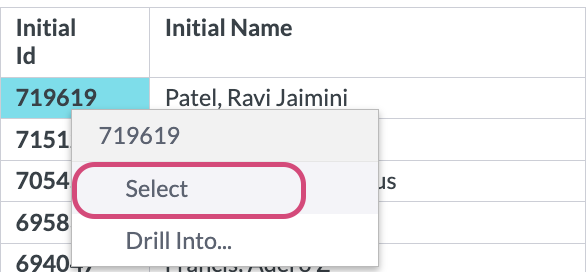
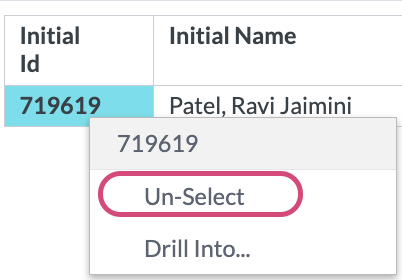
Select & Unselect
By right-clicking on ID fields, you can select and unselect individual or multiple options. This will also enable additional dashboard actions.
Actions Menu
The menu options at the top of the dashboard allow for actions to be taken based on certain functions from the dashboard. This section will cover actions to be made once a provider is selected, additional filtering options, and saving filtered views for quick access to pre-filtered dashboard reporting.
From left to right, the actions menu includes the following options: Profile Dashboard (only available when a 1 provider is selected), Full Screen, Actions +, Show/Hide Filters, Apply Saved Lists, and Menu (filter menu).

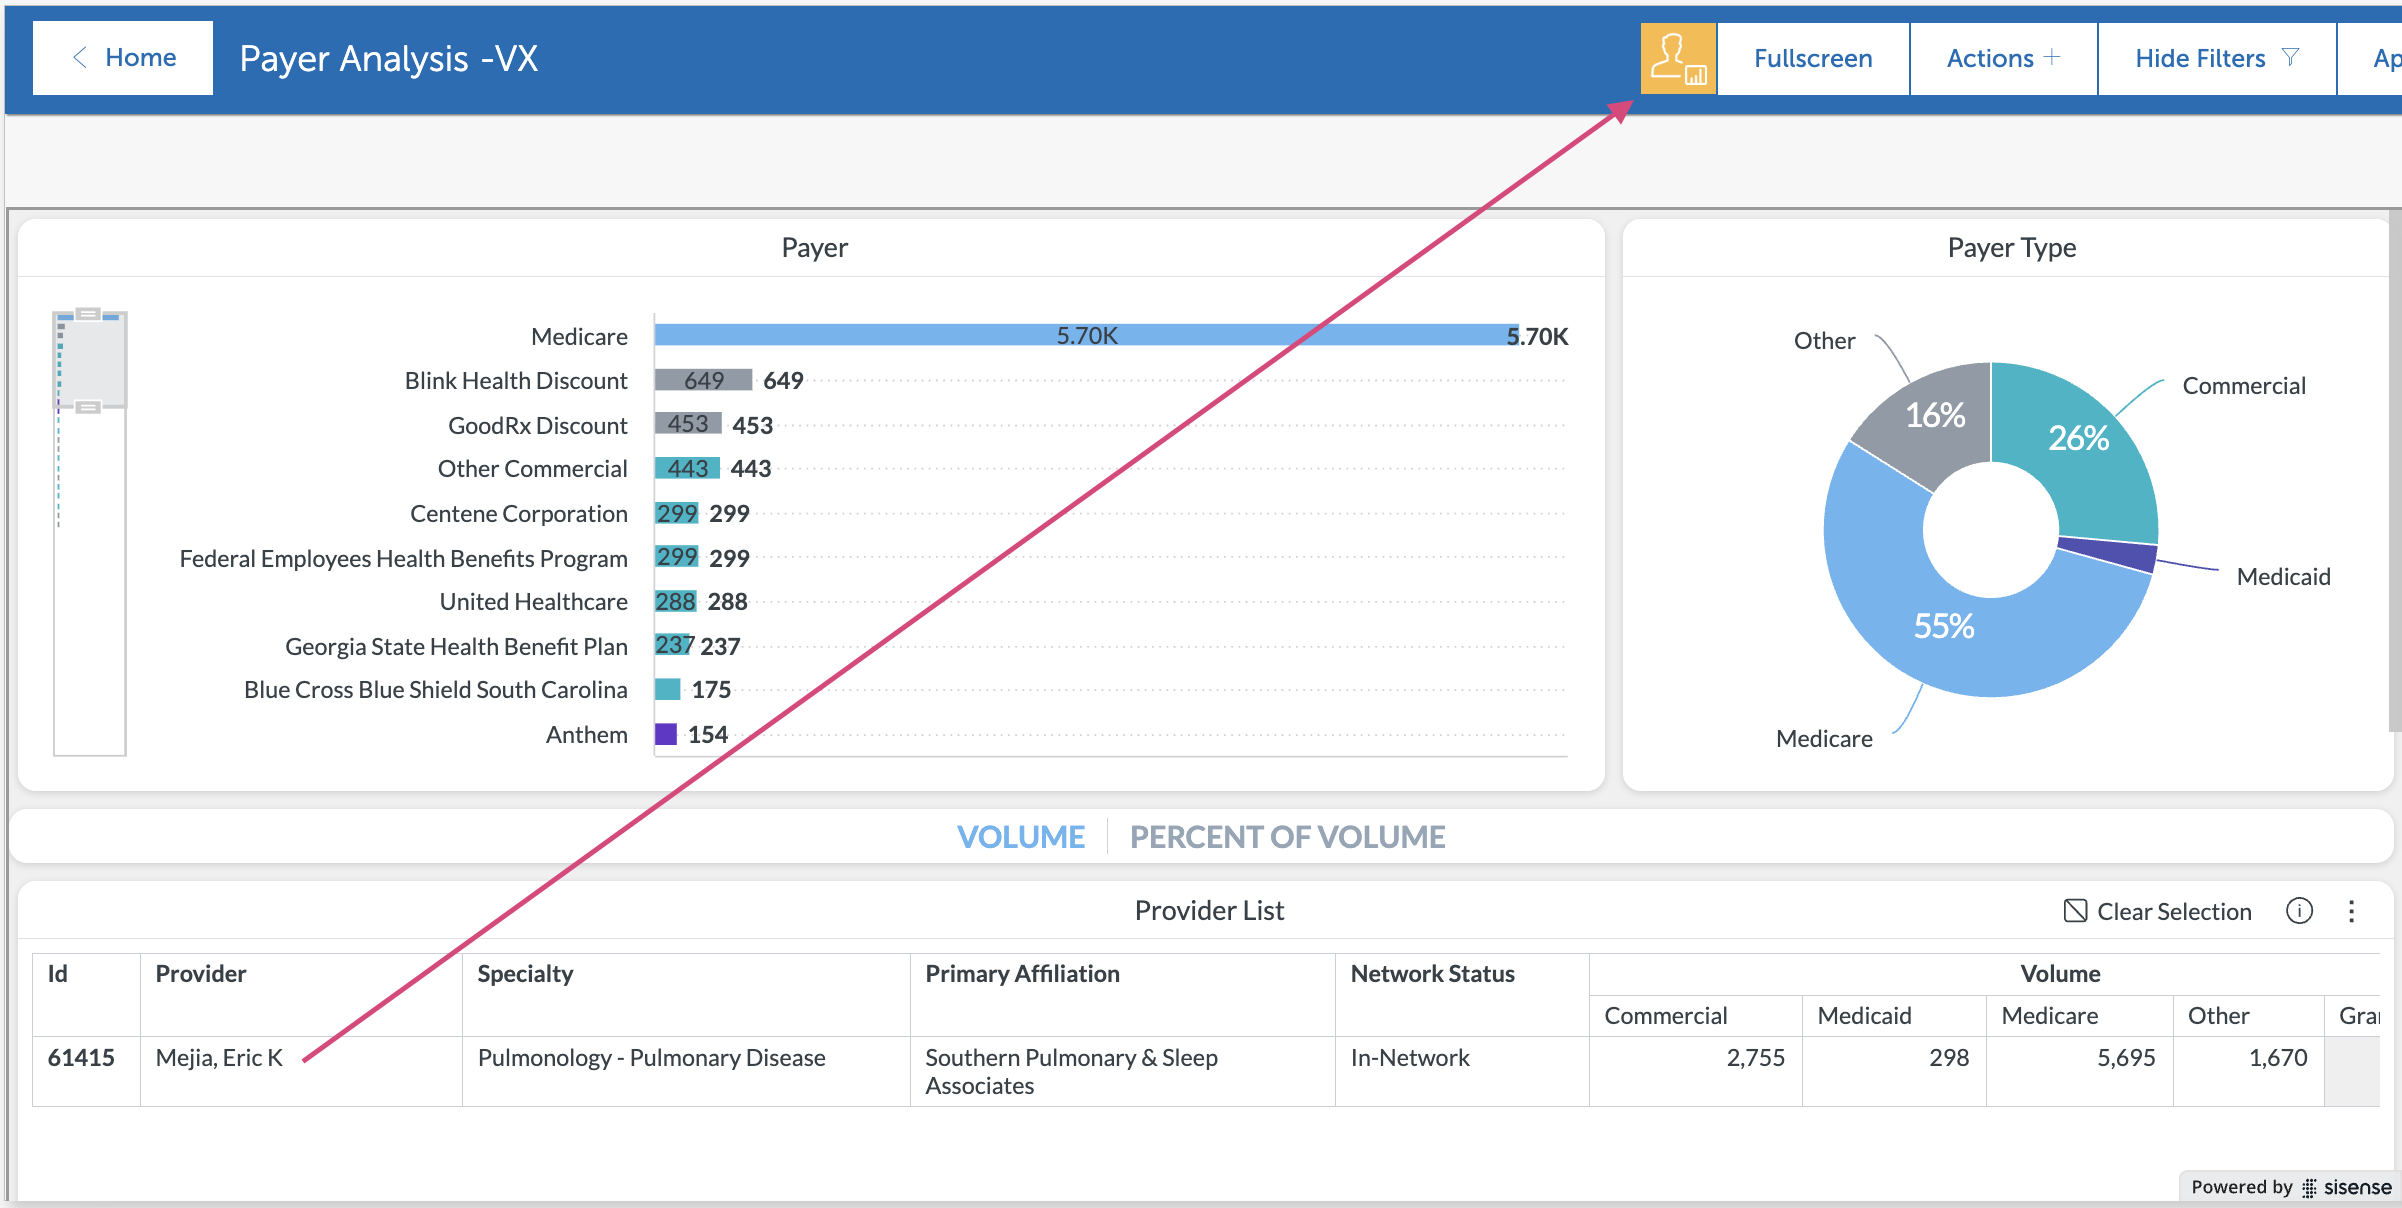
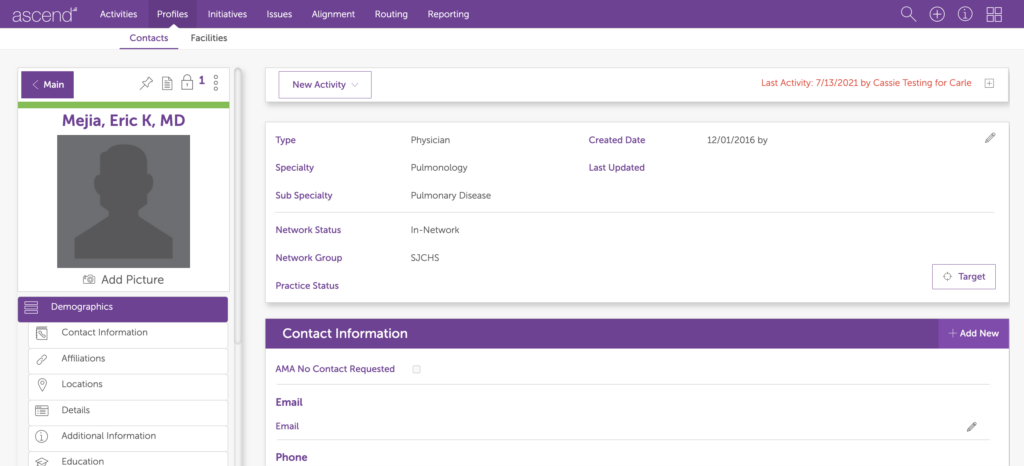
View Provider Profile Dashboards
You will know a single provider is selected when the yellow provider icon appears in the top menu. Click this icon to open that provider’s Ascend profile dashboards in a new browser tab.
Full Screen & Hide Filters
To optimize the dashboard view, options to go into full screen and hide the dashboard filters are available to maximize the data shown on the screen.
Full Screen adjusts the dashboards up to take over the space of the Scout header and hiding the dashboards widens the view by hiding the filters on the right-hand panel. The Full Screen and Filters buttons are dynamic, based on the view selected, and the copy will update to indicate to Exit Full Screen or Show/Hide Filters.

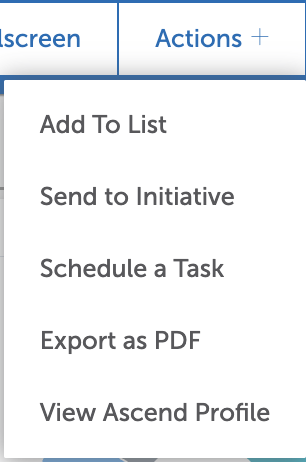
Actions +
By selecting one or multiple providers within a widget, you will enable additional actions, including adding selected providers to a list, sending selected providers to an initiative, scheduling a task with the selected providers, and when 1 provider is selected — the option to view the ascend profile will be available.
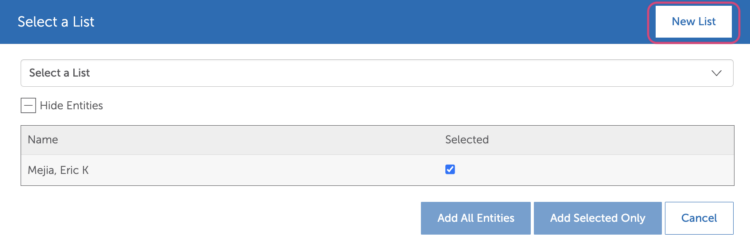
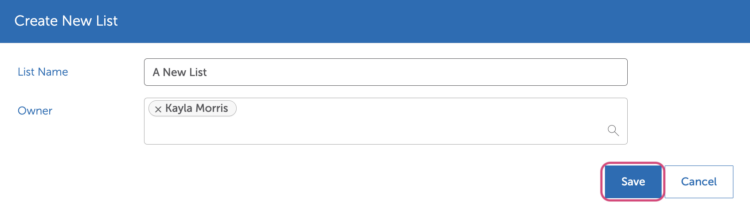
Add To List
Select one or more providers to either add to an existing list or create a new list. Use the drop-down box for an existing list or create a new list. Name and identify additional list owners. Click Add Entities or Save when finished.
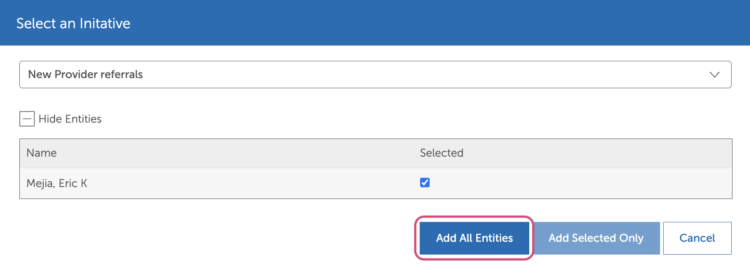
Send to Initiative
Select one or more providers to add as members to an existing initiative. Note: The initiative must already exist to add providers from a Scout dashboard. Click Add Entities or Save when finished.
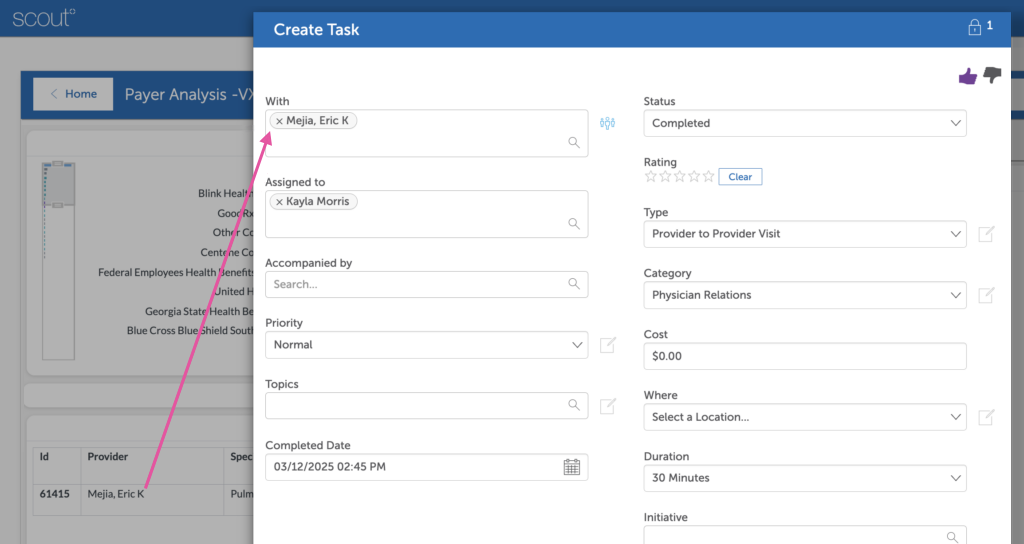
Schedule a Task
Select one or multiple providers to create an activity within Ascend. Fill in essential details like due date, type, and category. Click the “Save & Close” icon when finished.
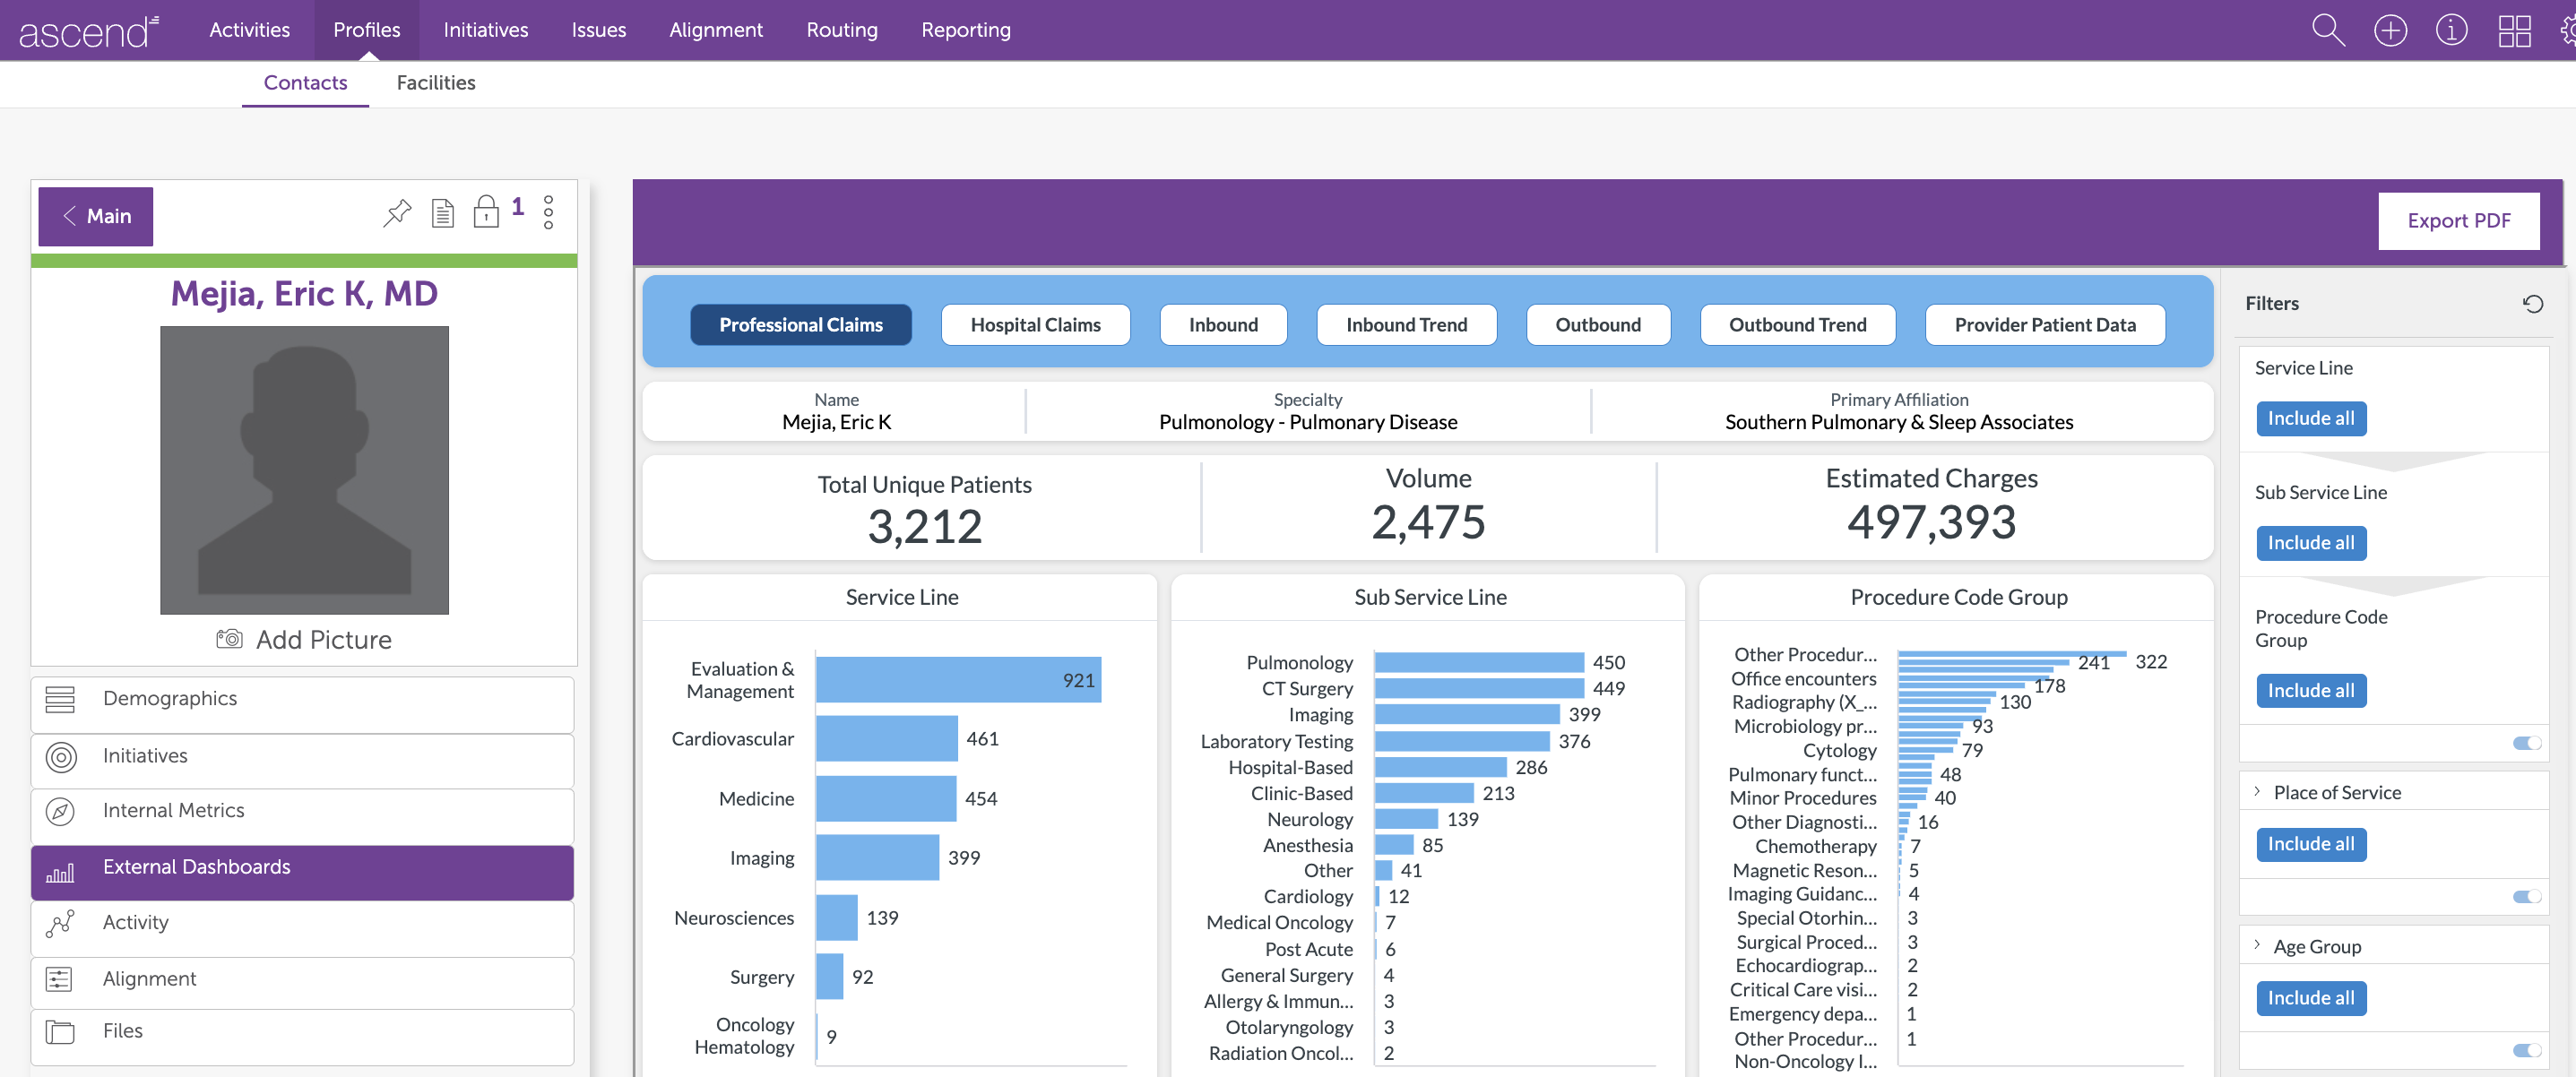
View Ascend Profile
When a single provider is selected, you can open their individual Ascend profile in a new browser tab.
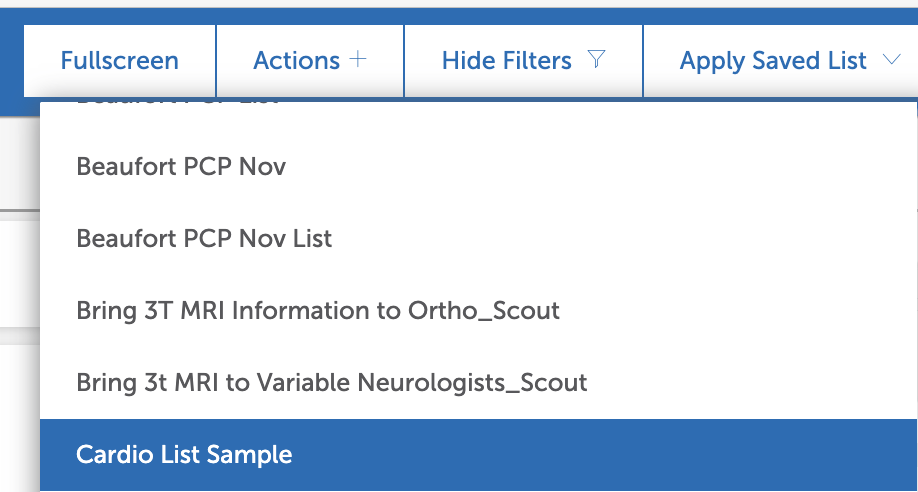
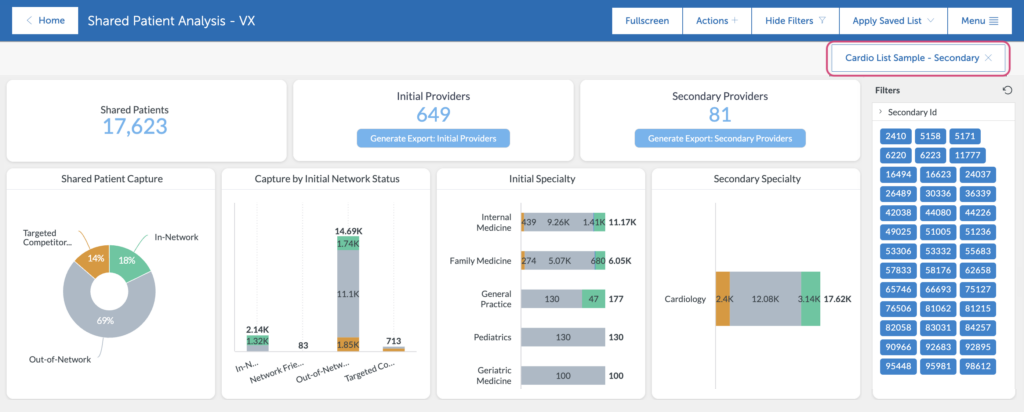
Saved Lists
You can apply Saved Lists from Ascend to the Scout dashboard by clicking on the “Saved List” icon and selecting your desired list from the drop-downs. The dashboard will reload and display data based on the related providers in the saved list & the dashboard. The provider IDs from the saved list will be populated in the PersonID filter.
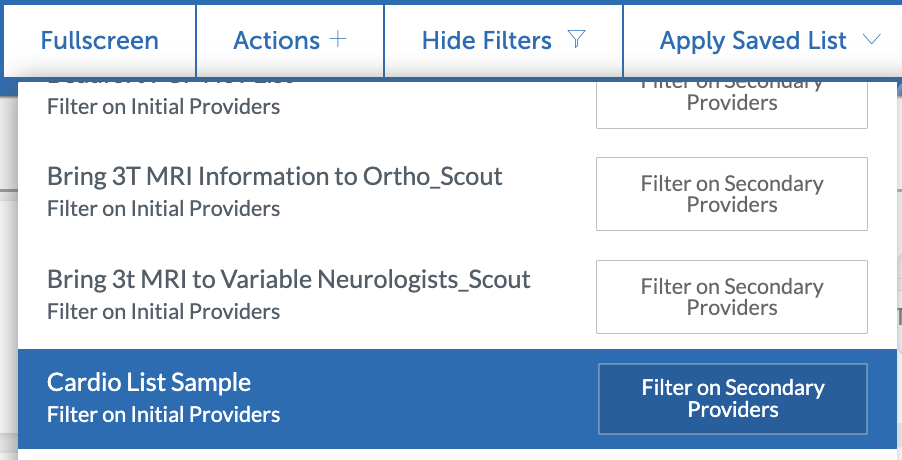
Some dashboards will have either a primary & secondary filter or an initial & referring filter option for saved lists. For primary & initial, click the option to the left. For referring & secondary, click the option on the right.
Once the list is applied, the list selection will show in the top right above the dashboards. This list filter can be removed by clicking the x next to the title of the saved list.
Export
There are several different export options in each dashboard, as well as individual dashboard widgets.
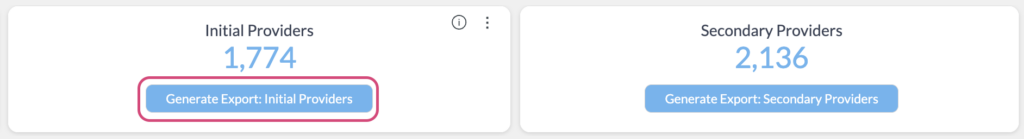
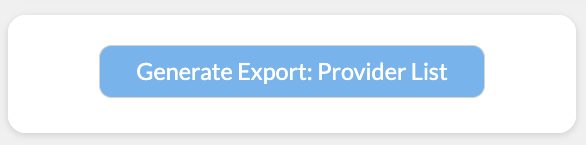
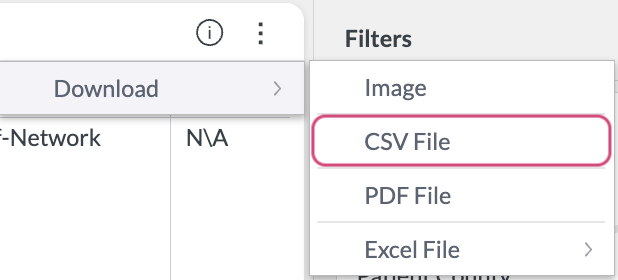
Generate Full Exports
If you would like to export a given list view, click on the “Generate Export” widget. This will open an exportable version below. Once the export is generated, click on the 3 vertical dot icon and choose download. CSV File is the recommended export format.
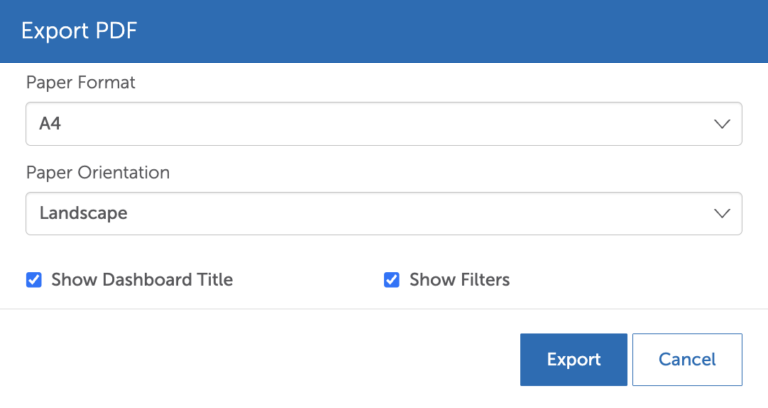
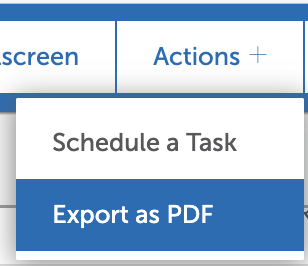
PDF Exports
To export a dashboard as a PDF, click the Action + option from the dashboard menu and select “Export PDF”. This will open a settings modal with defaults set for best results.
Additional Tips
You will notice additional dashboard features as you explore and learn. A few additional tips are highlighted below.
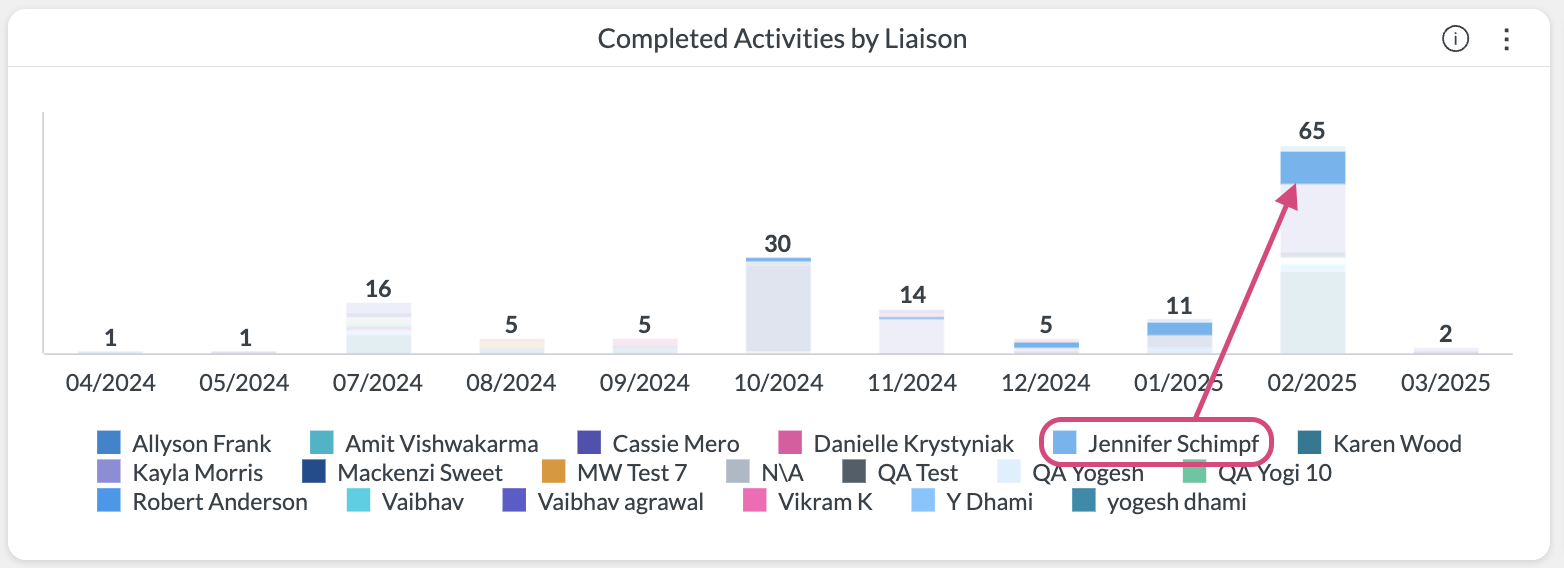
Legend Hover & Highlight
Whenever you see a chart legend with colors, you can hover on a specific value, which will visually highlight and grey out the remaining values.
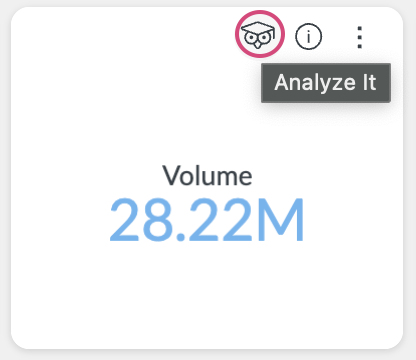
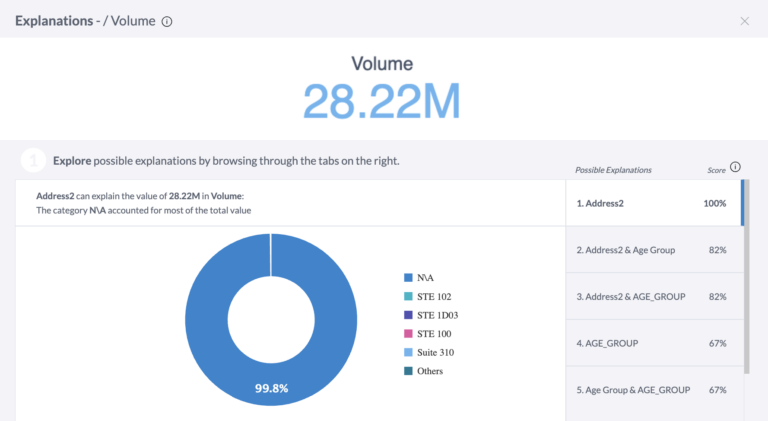
Analyze Data
Some widgets may include an icon called “Analyze it”. By clicking on this icon, a new pop-up will appear and allow you to visualize that widget by different values.